Difference between revisions of "Queue Management/Statistics"
Paulo Santos (Talk | contribs) (Created page with "<languages /> <translate> Installation =Dashboard= The dashboard displays real-time information about the current statistics of the Queue Management Syste...") |
Paulo Santos (Talk | contribs) |
||
| Line 5: | Line 5: | ||
=Dashboard= | =Dashboard= | ||
| + | |||
| + | [[File:Qmweb_dash.png|thumb|350px|Dashboard]] | ||
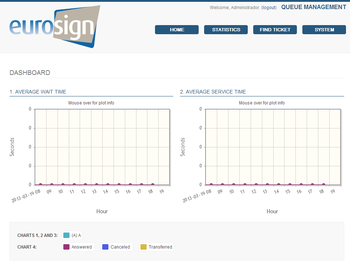
The dashboard displays real-time information about the current statistics of the Queue Management System. The four charts shows average wait and service time, number of tickets and their status for the current day. The charts data can also be viewed in the form of a table, also updated in real-time. | The dashboard displays real-time information about the current statistics of the Queue Management System. The four charts shows average wait and service time, number of tickets and their status for the current day. The charts data can also be viewed in the form of a table, also updated in real-time. | ||
| − | + | {{clear}} | |
=Statistics= | =Statistics= | ||
| + | |||
| + | [[File:Qmweb_stat.png|thumb|350px|Statistics]] | ||
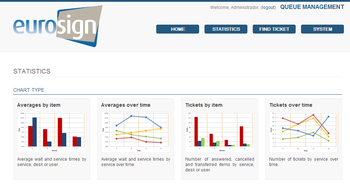
For a thorough analysis of the queues there are available several statistics generation methods. Each chart has a description of it's purpose. Furthermore, each one can also be filtered to better suit the intent of the analysis. When a statistics is generated, it will display the data in both chart and table format and can also be exported to XLSX format. | For a thorough analysis of the queues there are available several statistics generation methods. Each chart has a description of it's purpose. Furthermore, each one can also be filtered to better suit the intent of the analysis. When a statistics is generated, it will display the data in both chart and table format and can also be exported to XLSX format. | ||
| − | + | {{clear}} | |
=Find Ticket= | =Find Ticket= | ||
| + | |||
| + | [[File:Qmweb_findticket.png|thumb|350px|Find Ticket]] | ||
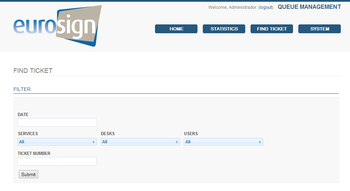
Find a single ticket and see all the information about it. | Find a single ticket and see all the information about it. | ||
| − | + | {{clear}} | |
=System= | =System= | ||
| + | |||
| + | [[File:Qmweb_system.png|thumb|350px|System]] | ||
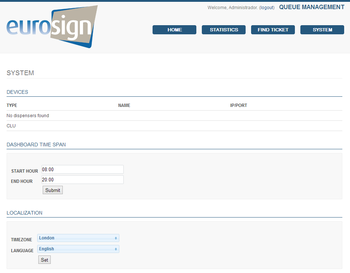
System configurable settings such as the start and end hour that the real-time charts will display and localization settings. There is also a table displaying every configured device in the Queue Management System. | System configurable settings such as the start and end hour that the real-time charts will display and localization settings. There is also a table displaying every configured device in the Queue Management System. | ||
Revision as of 12:08, 8 February 2013
<languages />
<translate>
Contents
Dashboard
The dashboard displays real-time information about the current statistics of the Queue Management System. The four charts shows average wait and service time, number of tickets and their status for the current day. The charts data can also be viewed in the form of a table, also updated in real-time.
Statistics
For a thorough analysis of the queues there are available several statistics generation methods. Each chart has a description of it's purpose. Furthermore, each one can also be filtered to better suit the intent of the analysis. When a statistics is generated, it will display the data in both chart and table format and can also be exported to XLSX format.
Find Ticket
Find a single ticket and see all the information about it.
System
System configurable settings such as the start and end hour that the real-time charts will display and localization settings. There is also a table displaying every configured device in the Queue Management System.
</translate>


